On Monday (13th January) I gave a talk introducing pupils of Wirral Hospitals’ School to the world of data analysis, and specifically crime analysis. It was my first time speaking to a younger audience, so I had a bit of a task trying to think about what is the appropriate amount of content to include, and level to pitch to. I didn’t want to be too simplistic and therefore condescending, but I also didn’t want to bore them with jargon and technical details. In the end I think it went well, there was lots of engagement from the pupils, and the head teacher gave me some positive feedback about the content as well as the delivery. So I thought I’d write this up for anyone else looking for resources, thinking about going into similar school settings to talk about data analysis or crime analysis or both!
Preparation
The first thing I had to do was collect possible materials to use. I split this into three groups:
- Content about data analysis
- Content about crime analysis specifically
- Activities to engage the students
Content about data analysis and associated activities
Firstly, I spent some time going through content which I had curated over the years of teaching and giving talks about data analysis. Some of my fave from this collection are visualisation of spells of Harry Potter. I also have Dear Data. The complaints postcard is a specifically good one to explain because you can immediately start drawing conclusions from it that people can relate to!
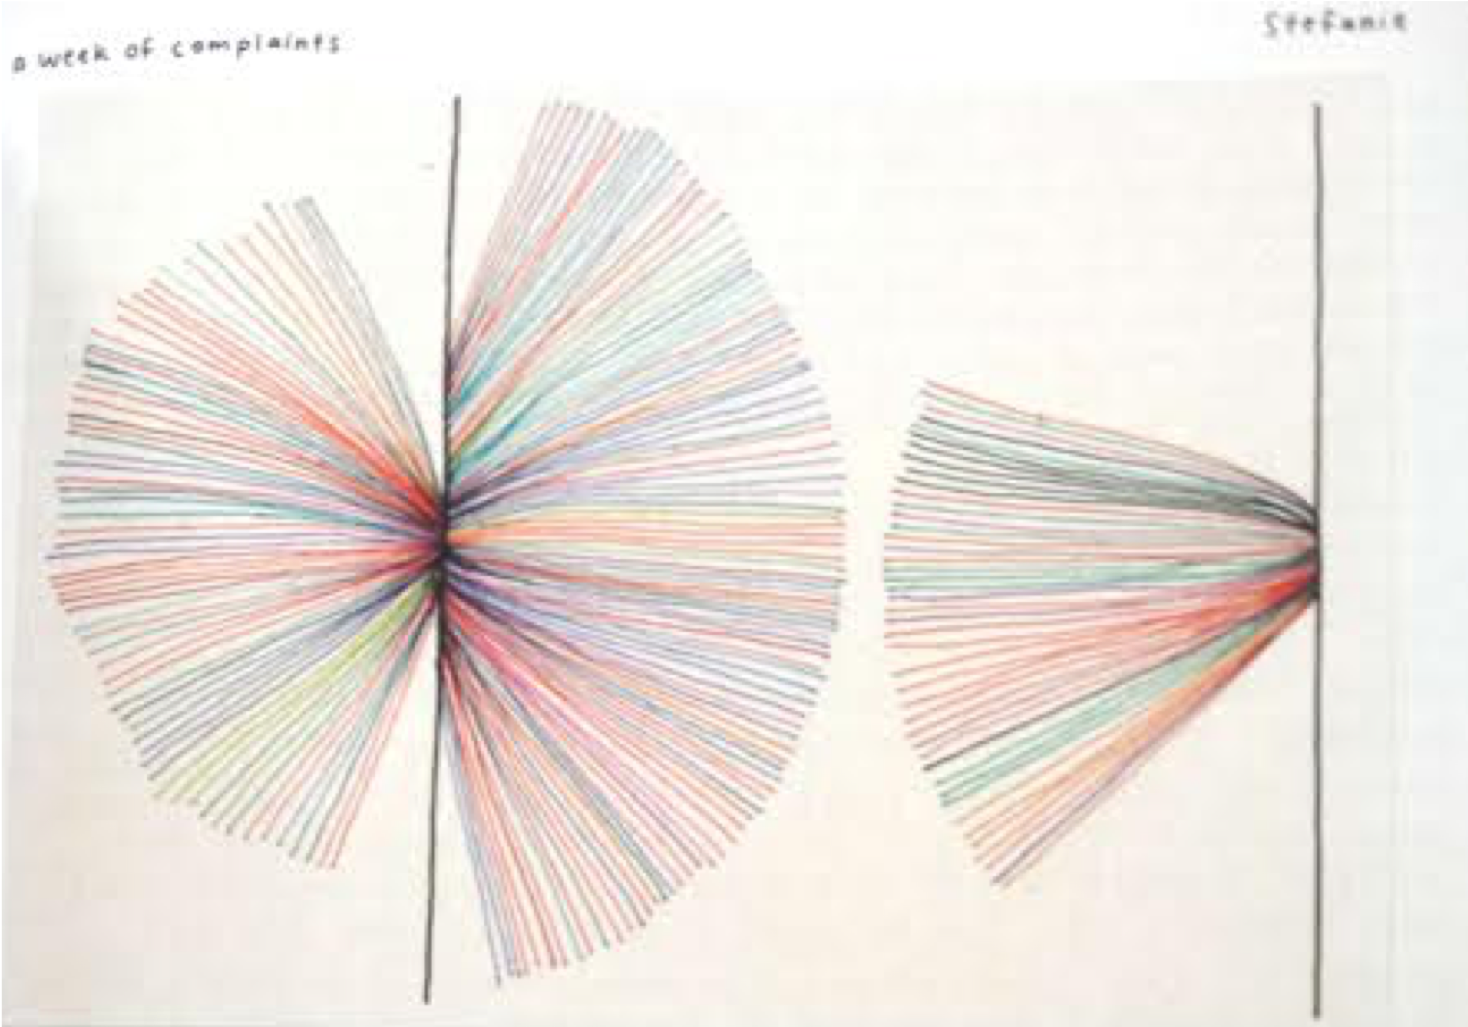
Complaints postcard from Dead Data by GIORGIA LUPI and STEFANIE POSAVEC
When I started writing the presentation I was actually on Vancouver Island with friends, and asked for advice there, and was recommended to think about #tidytuesday. Of course, this is an excellent resource of fun data sets, and also creative visualisations. Also pudding.cool’s rap artists’ vocabulary was mentioned as something kids would be interested in.
But even with such advice I thought I might not be reaching enough examples that are “down with the kids” (is Harry Potter still a thing?! Will it be awkward or funny when I mispronounce all the rap artists names?!) so I reached out to Twitter. Turns out this was an excellent idea, because I was met with a shower of useful resources.
You can see the thread of all the suggestions here: https://twitter.com/r_solymosi/status/1214835916637921282
So armed with all this, I had a very good selection of things to choose from now regarding data analysis in general. But what about crime analysis?
Content about crime analysis specifically
For this I thought I could introduce an easy-to-grasp framework, and work through two examples using it, one all together, and one as an activity. Specifically, I picked the SARA model to think about crime problems by analysing available information, and then maybe tapping into the students’ creativity for coming up with design solutions to tackle some crime problems.
For exercises, I initially thought about getting some data live, from police.uk, but I didn’t know what sort of devides they would have access to, whether or not there would be any sort of good internet connectivity, and so on, so for the sake of safety I decided to go analogue.
Specifically I picked two examples. First bicycle theft. For this, I followed the guide POP Centre Guide for Bicycle Theft by I use the popcentre report by SShane D. Johnson, Aiden Sidebottom, and Adam Thorpe as a guide, as well as all the info on http://www.bikeoff.org/. The site is great, especially the gifs explaining how some bikes get stolen, and the lots of creative designd for the response phase.
Then, for the exercise to do together, I used the example of handbag theft from pubs, modelled after POP Centre Guide for Theft of Customers’ Personal Property in Cafés and Bars by Shane D. Johnson, Kate J. Bowers, Lorraine Gamman, Loreen Mamerow, Anna Warne. Here, I used not only slides to work through this together, but printed out materials, in sealed envelopes labelled as “Scanning”, “Analysis”, and “Response”, handed out to individuals or small groups (“Assessment” was done together as a large group).
The idea would be that each “phase” will have some handout materials, and pupils will in groups (and with me helping along as well) will follow along. So first, for the “Scanning”" phase, I had 3 newspaper articles, all about handbag theft in pubs.
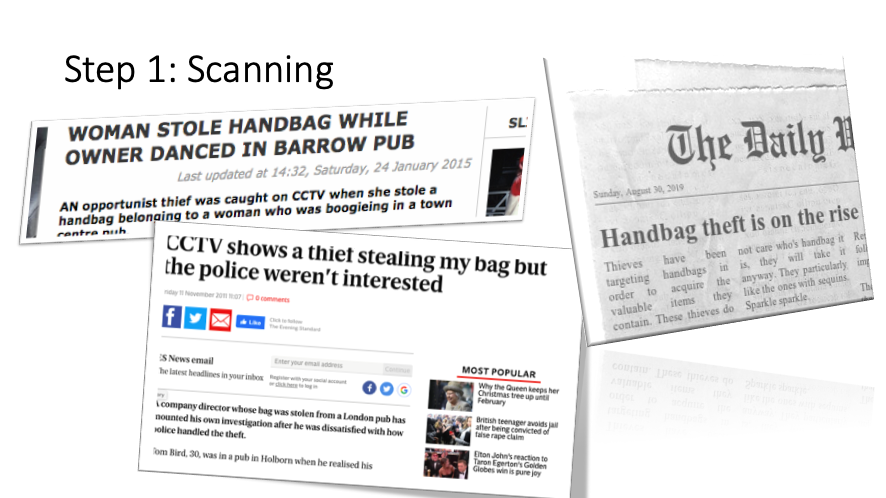
Material for the “Scanning” phase
Then, for the “Analysis phase”", we had two conflicting bits of intel from two informants. One usually lies, and one usually tells the truth. So how can we know who is telling the truth or lying? Well we also have a map of the pub, with the number of bags stolen from each table, which we can use to colour in a heat map. Then, with this heatmap we can decide which informant tells the truth.
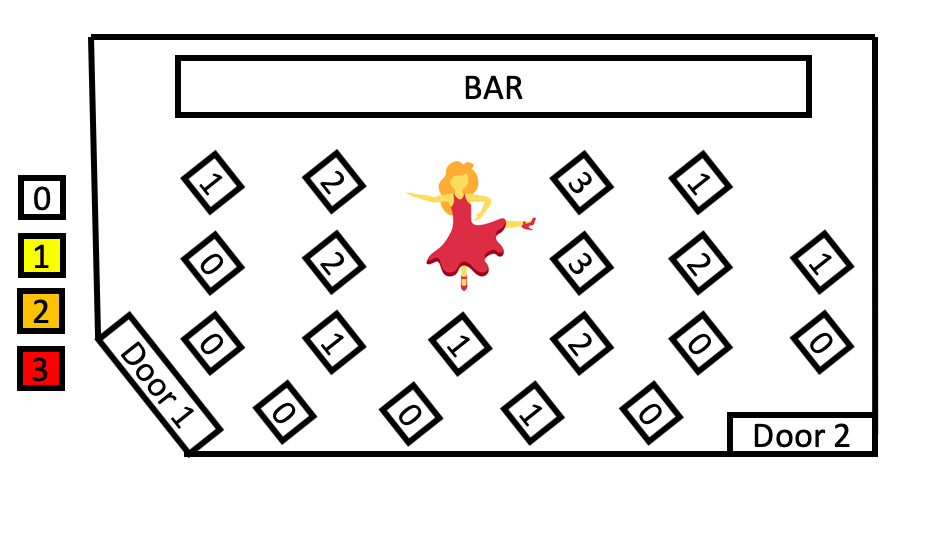
Pub floorplan for making heatmap of bag theft
Once we know this, we can open the second analysis envelope, to get some more information from our truthful infomant, who tells us that he’s after bags thrown under chair or hung on the backrest. Now, we get to the response phase, and the envelope here contains two types of chairs and also a table, on which pupils can draw their creative anti-bag-theft designs. I did not manage to come up with a small-group based activity for the “Assessment” phase, so instead we together as a large group discussed the results of the actual evaluation study.
The presentation
In the end, the presentation went as follows:
First, I spent a few slides introducing myself. When discussing earlier drafts with people, a few people did mention that one of the things the students will be interested in before any of the content is my accent! So I figured I would include a little map to give background on where my accent comes from. Then I talked a bit about my academic and work-life journey to where I am now. Turns out this is really good, because the assembly topic before my talk was about degrees, and education, and career paths, so this fit in very nicely.
Then I introduced data analysis with a one-liner (“Making sense of relevant data to identify patterns and answer questions”), followed by looking together at a particular data set: the #tidytuesday data set of Seattle’s registered pet names. I showed a screengrab of the data, followed by a chart showing that besides dogs and cats, the good peope of seattle also have pigs and goats registered. Then, I did a little bit of live coding, so that we could play the game “does your pet have a unique name?”. This was really great, because it immediately got many of the kids talking (and some of the staff!!). It was also interesting because it looks like there were pretty much no uniquely named pets, which we didn’t find at least one in the Seattle data base. Only at the end of the session (one girl came up after to ask about her dog, ‘lil marco’) did we find a unique pet name! This was excellend warm-up! Thank you #tidytuesday!
I then showed some more examples: another #tidytuesday entry on squirrel survey in Central Park, the Harry Potter spells (still relevant!), the rappers vocabulary (they asked about Eminem, perfectly pronouncable!), property prices in the UK (maybe more enjoyed by the staff), and of course Dear Data.
After this came the Skittles exercise, which was one of the recommendations I received from Twitter (thank you @duncanbradley_). This was also really great in getting pupils involved and interested. I got 12 packs of Skittles, handed them out, and asked the pupils if they think that any two between them will be the same. They were pretty convinced that they won’t be. One asked that surely this depends on how many are in each pack (correct!). So we started by counting all the skittles, which varied between 41-45 pieces. Next I asked someone to name their favourite colour skittle (was blue) and got them all to count their blue skittles. There were about 4 with the same number, so we moved onto the next colour, of which we only had a 2-way match, and the third favourite colour had already established that no two packets were the same (phew!). Then skittles were eaten, and we discussed how many packs are needed.
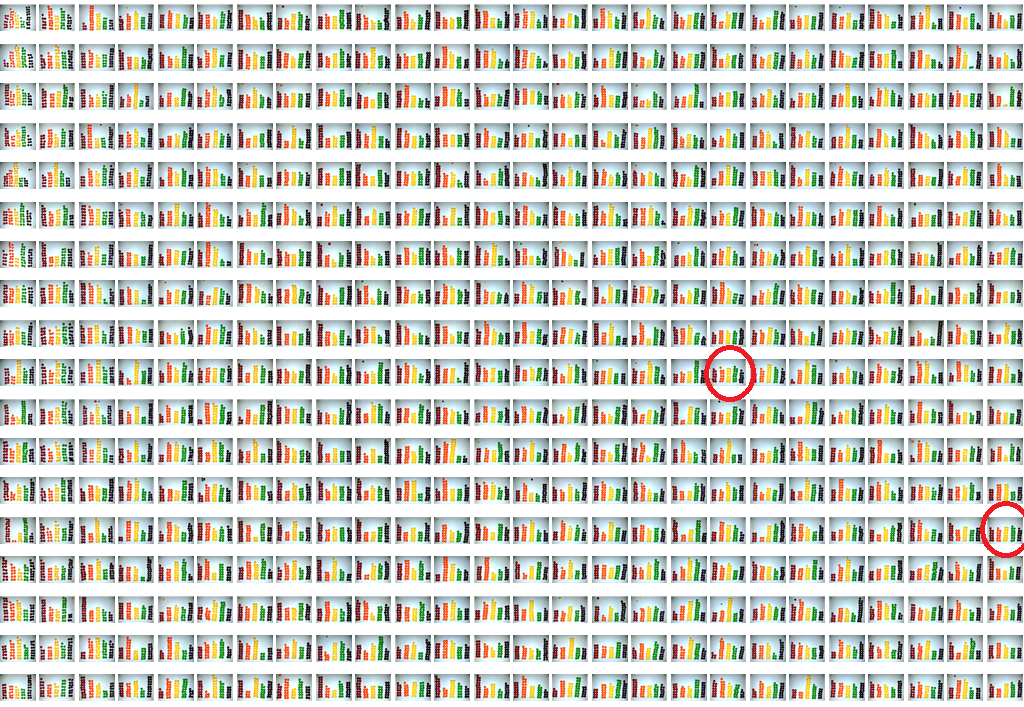
468 packs of Skittles from possiblywrong.wordpress.com
Then back to presentation mode, I showed some examples of crime analysis (the Trafford Data Lab’s dashboard for police.uk data was excellent), situational crime prevention examples (ticket gates, shattering pint glass), and then worked through the cycle theft example mentioned above using the SARA model. I asked, just before, how many of them had had a bicycle stolen, and half the room’s hands went up, while the other half seemed to know someone who’s bike was stolen. One girl mentioned she knew about bike marking (yay)! Then I asked who parks their bike on “informal” parking furniture. Again, almost all hands went up (including mine to be fair, we need more cycle infrastructure!!). So when I showed the gif for “lifting”, it got some gasps regarding how easy it is to steal such bikes.

How bikes are “lifted”
Finally it was time for the example of handbag theft from pubs. We opened the Scanning envelope, and had three articles. I emphasised “think about what you think the crime problem is as specifically as possible”. Well, not only did they come up with “theft of handbags from pubs” but a lot of detail, such as that thieves go for flashy expensive looking bags (tapping into some CRAVED characteristics there…!) and that its because the owners are being careless, distracted, or otherwise inadequate guardians (I swear I did not show a crime triangle!!). Having established this specific problem, we reached out to our two informants, receiving some conflicting intel. One says he works near the doors, while the other likes to target the busy dance floor. It was time to colour in the heatmap to establish who is lying and who is telling the truth. This was also pretty easily tackled by the students, and we quickly moved on to trust out informant “B” and get some more information about how he steals handbags, and use this to open our response folder, which had the three pictures of furniture: two chairs and a table in it, which students drew their designs on. There were some really good ideas (one student actually drew the grippa clip, without having seen them before!) and I was impressed that everyone came up with at least one solution!
We wrapped up by talking about the real study, the outcome of the evaluation, and then some general questions about crime analysis.
Thoughts
Overall I really enjoyed this experience, and would gladly do it again. The students were really engaging and welcoming and I had a lot of fun listening to their ideas and designs. For anyone thinking about going into your local school, mainstream or non-mainsteam, I strongly encourage this. Especially if you’re early careers! The headteacher said a really nice thing to me at the end, she said that because students perceive me as closer to them in age, they might start to see this sort of career and academic trajectory as open and accessible to them, if it’s not something they would have thought about before. Of course many of these students are exceptionally smart, and are going to go on to great things without any input from me, but if I could give a bit of inspiration to one person, I’m pretty happy about it.
And if you reading this are interested to go give a similar talk in a school, please feel free to use my materials, and just let me know if you want to talk about my experience at all!
The slides are available here: https://www.dropbox.com/s/gap5ibu3sc3lsjy/wirralschool.pptx?dl=0
And the handouts are available here: https://www.dropbox.com/s/scb2ccjqtzrxy4m/handouts.pptx?dl=0